Thursday, May 28, 2020

"Qualitative" vs "quantitative"

The community and network post I started with this week seems to have gotten me into a vocabulary mood. Here I'll share some thoughts on "qualitative" and "quantitative" research.

Or one thought: it's a silly distinction.

About 2500 years ago, Plato and Aristotle proposed 2 ways of conceptualizing the world. Plato focused on abstractions and ideals while Aristotle focused on empirical and practical issues.

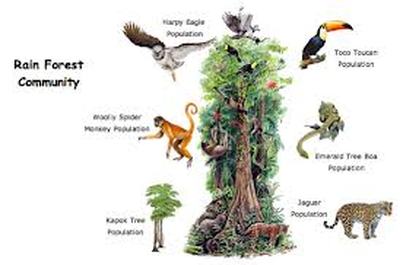
Aristotelian thought has been valuable for what we call natural sciences. Classification is the king of methodologies in this thought tradition, and biology has been a major beneficiary. This mode of thought is associated with the rationalism and technology gains of the European medieval and renaissance era.
Plant Classification Chart | Biology plants, Plant classification ...
https://www.pinterest.com/pin/493566440386147691/

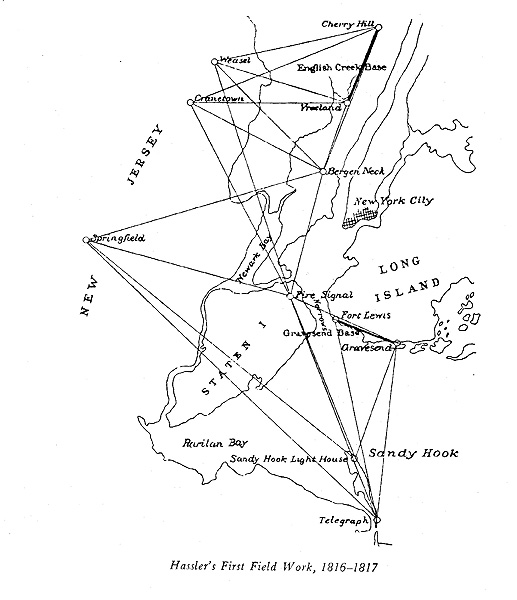
Platonic thought is valuable for what we call the hard sciences, where math can clearly describe what we observe in the world. After Newton (and others) created calculus to describe motion around the beginning of the 18th century, this mode of thought had a revival and dominated European philosophy through the industrial revolution.
Intro Physics w/ Calculus. Kinematic equation derivation 1 - YouTube
https://www.youtube.com/watch?v=ShiWQ5vqEkY

But then, about 100 years ago, Einstein and his contemporaries ran into the limitations of this method; they could not adequately describe the world in abstract terms. Twentieth-century scientists from Whitehead to Hawking pointed out the need to draw on all available powers of observation, abstraction, and logic to compensate for the limitations of each individual method and improve our collective understanding.

In fields like environmental science, where all viable methods are welcomed for their ability to contribute knowledge about a phenomenon, we have made good progress. Our success with the hole in the ozone layer during the late 20th century is a testament to the power of modern holistic thinking.

For a fascinating look at this history up to the early 20th century, explore
Whitehead, A.N. 1929. Science and the Modern World: Lowell Lectures 1925. Cambridge University Press, London.


"Triangulate"

Much like the words "community" and "network" that I blogged about earlier this week, I have a definite sense of what it means to triangulate data. It's a method that applies geometry and trigonometry to accurately measure distances and locations.

At its simplest, from https://en.wikipedia.org/wiki/Triangulation_(surveying):
Triangulation-boat.png

Less simply, from https://celebrating200years.noaa.gov/survey_marks/hasslers_first_sketch.html:

I find myself almost offended by the way the term is used in qualitative research, from https://www.meetup.com/ResearchOps-San-Francisco/events/265733187/:

It is certainly possible to draw a triangle between the labels of 3 data sets, but this figure has nothing to do with geometry or trigonometry, or triangulation or analysis. I feel co-opting the term provides a thinly veiled illusion of rigor for qualitative research while simultaneously discounting the rigor and precision involved in surveying. Why don't qualitative researchers just say the different datasets agree or don't agree?

Nice thing about the internet, you can almost always find someone to agree with you. ;)
Oppermann, M. (2000), Triangulation — a methodological discussion. Int. J. Tourism Res., 2: 141-145. doi:10.1002/(SICI)1522-1970(200003/04)2:2<141::AID-JTR217>3.0.CO;2-U

Wednesday, May 27, 2020

"Community" and "network"

I have a very definite idea of what I consider a network and a community, but it's based on network science and ecology definitions. (If you're reading this, you're in my class this summer so you can look at the first week discussion board for more details. I don't want to duplicate that discussion here.) In honor of the infographic and educationalgifs subreddits I joined this week for the community norms assignment, and in honor of Courtney's blog at https://summer2020eme6414.blogspot.com/2020/05/community-vs-network.html, I wanted to post some pictures that I think get my point across for me nicely.

Networks:
Network SolutionsFrom https://www.newcybersource.com/network-solutions/. Networks are nodes (people, organizations, cell phones, etc) that are connected (work history, social group, etc).

Communities:
Picture
From https://katiegrasch-ecology.weebly.com/communities.html. In ecology, a community includes interacting populations (kapok trees, toucans, and jaguars, etc). In sociology, I feel like a community includes interacting groups of people (teacher, students, administrators, cleaning staff, etc).


Thursday, May 21, 2020

GIS for Learning

As mentioned before, but repeated here in case you are starting with this post, I need to find a better way to explain what I mean when I say, "I want to apply tools useful for understanding and managing natural resources to better understand and manage learning systems." I realize that statement is not at all descriptive to anyone who hasn't done large scale resource management. The name of the technique, "computational modeling," isn't very helpful, either, unless it's already familiar. One effective way to describe a difficult concept is through analogy, and this seems like a good forum to try out some ideas. I hope you'll leave a comment to let me know what you think!

The navigation systems in our cars and phones have changed the way we move around. We are more aware of all the destination options available to us. We can easily choose our type of experience, whether we want to take a scenic route or the fastest route. We can make better choices with readily available information like the cost of a trip in money and time. We can more easily avoid problems like traffic jams. This is possible because of the great strides made in Geographic Information System (GIS) technology over the past few decades.

A GIS is able to combine many different types of data. It can hold discrete data like store and home locations. It can hold network data like road and trail systems. It can even hold continuous data, like elevation, to help you find a bike-worthy route through Tallahassee. GIS combines these data across many systems. Transportation networks, cultural institutions, weather, other people's opinions, they all might factor into our decisions about where we will go. GIS is a visualization and analysis tool that can help us make better decisions, a decision support system based on computational modeling.

A decision support tool for visualizing and analyzing a learning system could help us make better decisions in the realm of education. Such a tool would allow us to better understand the opportunities and constraints in our social and professional networks, educational institutions, and cultural climate. We could more easily find and access resources to facilitate learning. We could choose the type of learning experience we wanted, informal or formal, behaviorist or constructivist. And we would know the cost in money and time of our choices. We could all make more informed decisions.

Learning as Ecology

As mentioned before, but repeated here in case you are starting with this post, I need to find a better way to explain what I mean when I say, "I want to apply tools useful for understanding and managing natural resources to better understand and manage learning systems." I realize that statement is not at all descriptive to anyone who hasn't done large scale resource management. The name of the technique, "computational modeling," isn't very helpful, either, unless it's already familiar. One effective way to describe a difficult concept is through analogy, and this seems like a good forum to try out some ideas. I hope you'll leave a comment to let me know what you think!

There are many parallels between an ecosystem and a learning system. An ecosystem is comprised of biotic elements, the groups of species that interact, and abiotic elements like water, rocks, and climate. An ecosystem is governed by rules like gravity, and impacted by events like storms. It is driven by the flow of energy. To describe an ecosystem, you have to include all the elements and the relationships between them.

A learning system is comprised of biotic elements, the people and the roles the people fill, and abiotic elements like learning resources, home and school spaces, and culture. A learning system is governed by rules like policies, and impacted by events like pandemics. It is driven by the flow of information. To fully describe a learning system, you need to include all these elements and the relationships between them.

Over the past 50 or so years, ecologists have used computational modeling to visualize, analyze, and manage all the elements and relationships that make up an ecosystem. The great strides we have made toward solving our problem with the hole in the ozone layer represent our potential to analyze and manage a complex ecosystem with computational modeling. Computational modeling gives us the ability to concurrently analyze many types of data across a system: the elements and interactions, flows and impacts. Applying this technique to learning might improve our understanding of how learning works as well as our ability to manage a learning system.


Wednesday, May 20, 2020

Learning Managment as Land Management

I need to find a better way to explain what I mean when I say, "I want to apply tools useful for understanding and managing natural resources to better understand and manage learning systems." I realize that statement is not at all descriptive to anyone who hasn't done large scale resource management. The name of the technique, "computational modeling," isn't very helpful, either, unless it's already familiar. One effective way to describe a difficult concept is through analogy, and this seems like a good forum to try out some ideas. I hope you'll leave a comment to let me know what you think!

Through the mid 20th century, managing large tracts of land for multiple purposes required a lot of intuition. Imagine being the first Director of the US Forest Service in 1905, charged with providing for recreation, timber, clean water, aesthetics, mineral extraction, fire protection, etc, across all the different types of landscapes in the country. The sheer number of factors that might impact just one part of that landscape is mind boggling. But here is where one of my favorite cognitive tools comes into the story to save the day: maps. Maps can abstract some of the most prominent and crucial landscape features into a form that provides the Big Picture with almost no cognitive effort. This allowed people to dedicate their mental energy to identifying patterns within this big picture. While old paper maps can help frame the overall problem, it was the growth of aerial photography in the early 20th century and then satellite imagery in the latter part of the century that provided land managers a tool for managing on a day-to-day basis using near real-time data about this vast and varied landscape.

Even though maps can help frame the overall area of concern and imagery can give you constant data on the actual characteristics across the entire landscape, land managers still faced an overwhelming number of factors that could impact the land. Even more factors, now, with the inclusion of all this remotely sensed data. Enter computational modeling. With the growth of computing resources, land managers were able to off-load all the factors they knew that might influence the landscape into a computer. They told the computer what they knew or suspected about the on-the-ground impacts of these factors. The computer then did the math on all these assumptions and told the managers which of these assumptions actually manifested in all the real time data coming in and which did not. This allowed land managers to verify and discard their intuitive assumptions, steadily improving our understanding of ecosystem dynamics, how ecosystems change over time based on interactions of impacting factors. These computational models formed the basis of decision support systems, like GIS (geographic information systems). These decision support systems, the ultimate cognitive tool, stored everything that many people knew about the landscape, expressed the confidence level of this knowledge, and allowed each decision maker to optimize decisions based on objectives and risk tolerance.

It is not likely that humans will ever have a computational model that can completely mimic the real world. In The Hitchhiker's Guide to the Galaxy, the computer capable of processing such a model was Earth, itself. This does not diminish the value. Computational modeling is a powerful research and management tool. The gains in our understanding of the landscape and our place in it, environmental science, is founded on computational modeling. This same tool could bring clarity to the vast number of interacting factors that influence learning. Computational modeling could form the basis a cognitive tool to help educators and individuals make decisions to achieve a learning goal in the most effective way for that learner, in that place, at that time.


Wednesday, May 13, 2020

Book Review: "Linked"

"Linked: The New Science of Networks" by Albert-László Barabási is the most approachable description of network science I have encountered. Barabási is a pioneer in the development of network science so he understands the subject deeply. Coupled with a clear and engaging writing style, the book was a pleasure to read.

This book does not focus on learning or education, but the descriptive phrase on the cover, "How everything is connected to everything else and what it means for science, business and everyday life" highlights how the topic spans many disciplines. Network science allows us to understand many types of networks, from circulatory systems to the internet. Within the instructional design and learning technologies field, we might focus on social networks or knowledge networks. Insights from this book can help clarify how we might best approach research into these phenomena, including research into web 2.0 technologies.


Barabás, A.L.. 2002. Linked: The New Science of Networks. Perseus Publishing, Cambridge, MA.

Book Review: "Science and the Modern World"

The collection of Alfred Whitehead's lectures from 1925, published in 1929 by Cambridge University Press (now in the public domain, including at https://openlibrary.org/works/OL1133704W/Science_and_the_modern_world), provides a clear overview of philosophy and metaphysics over the course of European history since the ancient Greeks. Well, a clear overview through the 19th century, anyway. The word "modern" in the title is not exactly applicable anymore. The book is not focused on learning or instruction, though, as prominent cultural events, the topics are mentioned.

What I did get from the book is a much better appreciation for how prevailing social views have evolved over the millennia, and where I stand in relation to this history. People who hold fast to qualitative-only or quantitative-only methodological doctrine might be interested in the concluding sentence of chapter IX Science and Philosophy: "It should be the task of the philosophical schools of this century to bring together the two streams into an expression of the world-picture derived from science, and thereby end the divorce of science from the affirmations of our aesthetic and ethical experiences." My impression is that Whitehead was looking to the 20th century to bridge the Aristotle-Plato divide, the classification-measurement divide, the science-humanity divide. Purely quantitative and purely qualitative research methods represent these extreme positions, while advances in physics and medicine during Whitehead's life demonstrated a synthesis not adequately represented by either position in isolation. Web 2.0 technology may be well suited to analysis from both positions, bridging measurable statistics and descriptives to present a more complete understanding of the phenomenon than could be derived from either perspective, alone.


Whitehead, A.N.. 1929. Science and the Modern World: Lowell Lectures 1925. Cambridge University Press, London.

Book Review: "Pragmatism, Post-Modernism, and Complexity Theory"

I thoroughly enjoyed reading "Pragmatism, Post-Modernism, and Complexity Theory: The 'Fascinating Imaginative Realm' of William E. Doll, Jr." edited by Donna Trueit. The book is a collection of articles from Doll's 50 year career as a "curriculum theorist" with some additional commentary by the editor. It outlines his philosophical journey through the late 20th and early 21st century, as impacts from quantum physics and computing shaped post-modern philosophy and led to the development of complexity sciences. He focuses on what these philosophical changes mean for our understanding of the learning process.

I was particularly struck by his viewpoint on Piaget. While the phrase "ages and stages" may be a common association, Doll highlights Piaget's focus on transitions and the interactive processes that stimulate change. Web 2.0 also happens to be about stimulating change with interaction! Doll also brings connections between Piaget and evolutionary biology into stark relief. I was surprised to learn that Piaget's dissertation was on how mussels respond to changes in their environment. Doll also points out some correspondence between Piaget and Prigogine, a complexity science pioneer.
I highly recommend this book!


Doll, W.E.. 2012. Pragmatism, Post-Modernism, and Complexity Theory: The 'Fascinating Imaginative Realm' of William E. Doll, Jr. Routledge, New York, NY.